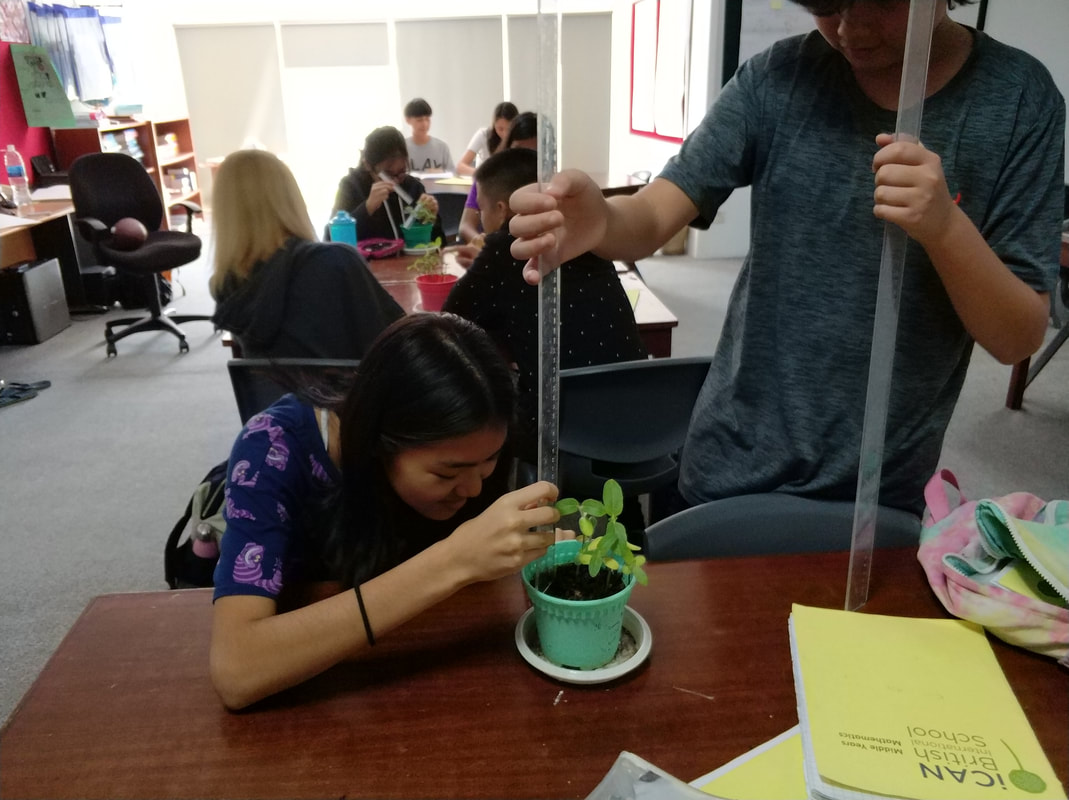
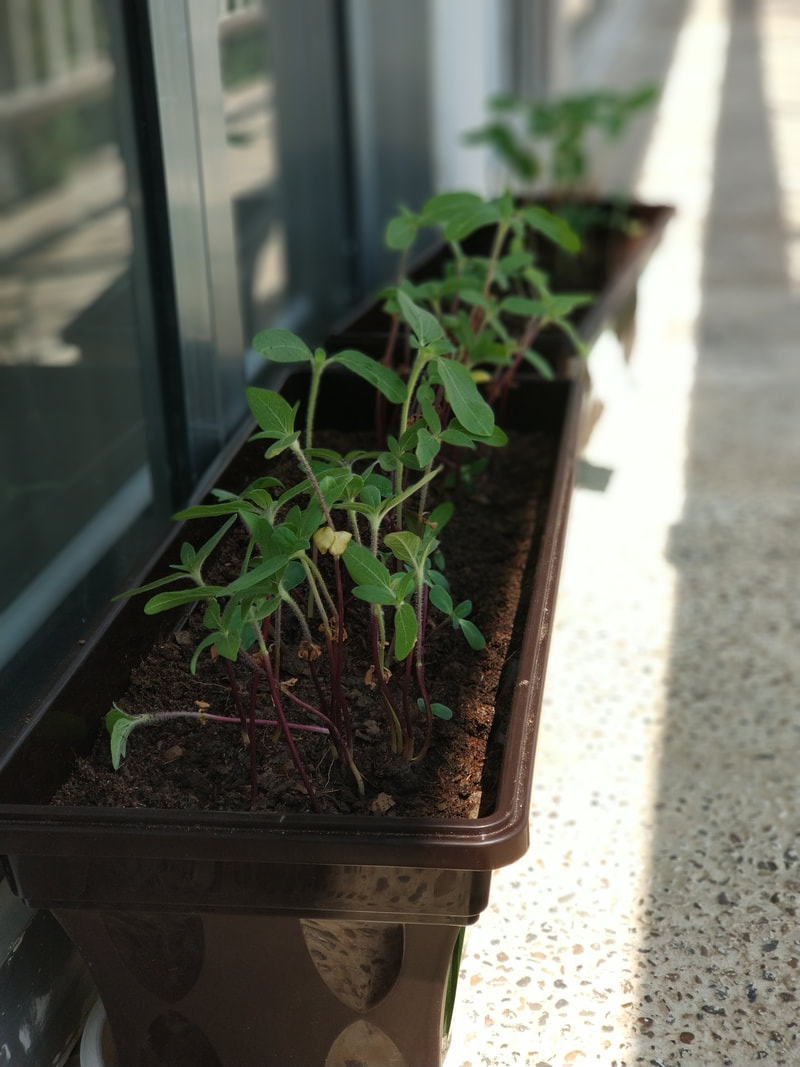
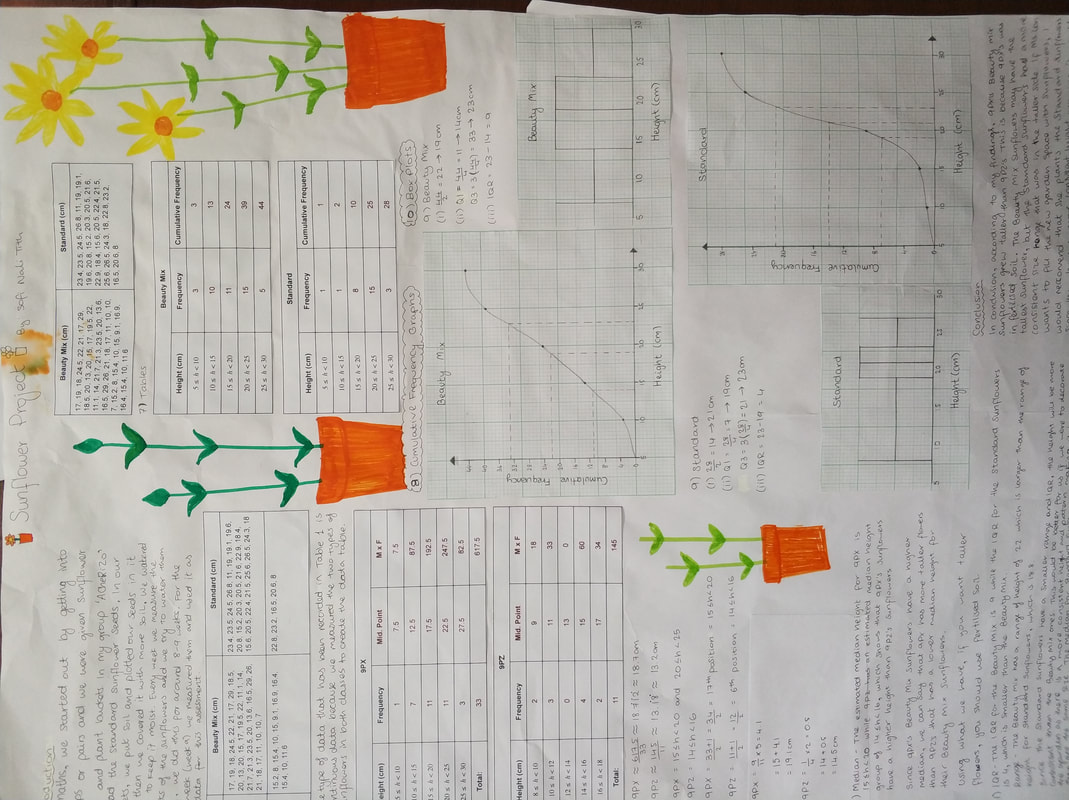
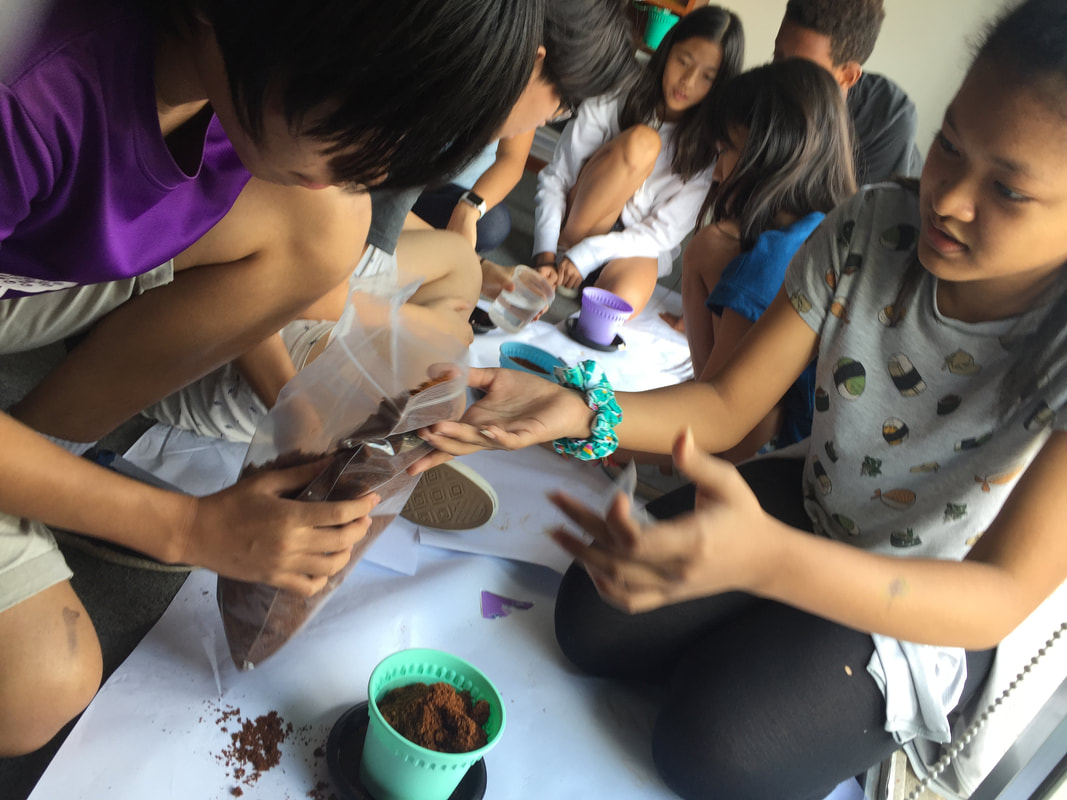
The Year 9s have been growing sunflowers and learning how to represent continuous data. They have been working hard to consolidate their data handling skills, and for their end of unit project they collected their own data by measuring the heights of sunflowers. The learners had to make comparisons between the heights of sunflowers grown by 9PX and 9PZ, and also the difference in height grown by each sunflower species. They were able to estimate the mean height from grouped data, represent the heights using a cumulative frequency graph and compare the sunflowers using box plots.
|
|
|
 RSS Feed
